Monitor Compliances
DashBoard
All dashboards chart provide drill-down detailed report.
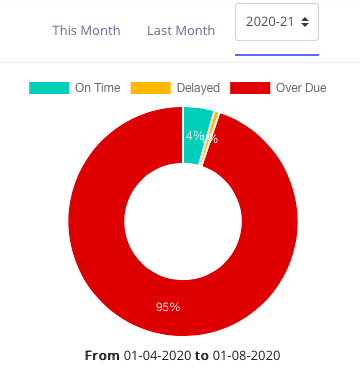
The Pie Chart shows % Compliances Completed OnTime, Completed Delayed and Overdue
The Pie chart can be seen for This Month, Last Month and any Compliance Period. Based on this selection only compliances with due date falling within the selected period are considered.
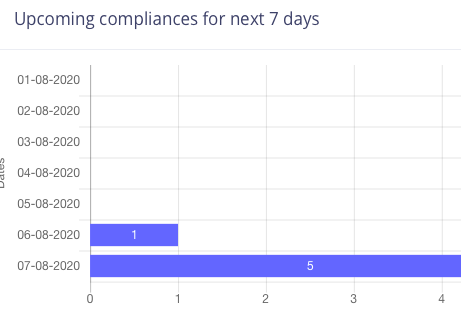
This chart can be used for planning the next 7 days.
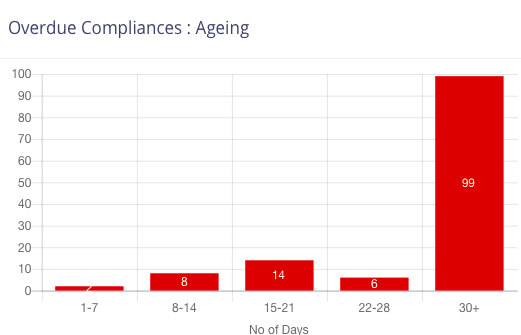
Ageing of overdue compliances can help in prioritising completion
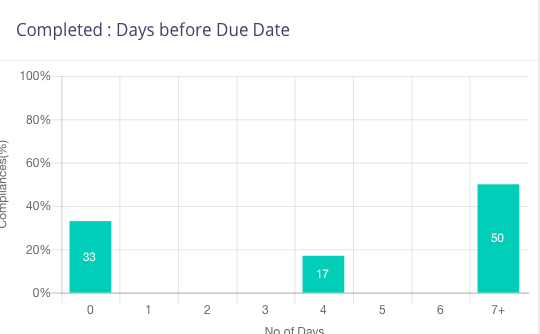
This chart shows all Online Completed compliances and their difference from due dates. So a compliance completed on the due date will come under 0 , and a compliance completed 6 days before due date will come under 6.
This chart can be used to build Do-Not-Wait-Till-Last-Day culture in the organisation
Compliance Break Up Summary
This table shows break-up of compliance entity wise or user wise. For user wise a chart display is also available
Audit Compliance
This report shows details of all compliances including proof documents for the selected entity and compliance period or a Financial Year
This report is useful for Auditors.
You can also download complete details including proof documents. This is recommended as a local backup for you